The propagation of light pollution in the atmosphere leads to skyglow which is the result of scattering of artificial light by cloud, aerosol, and pollutants such as suspended particulates in the atmosphere. Scattering spreads the light pollution effects to distances beyond the position of the lighting source and forms a light dome if viewing from a distance, or even brightens the entire night sky.
Night sky brightness (NSB) is one of the indicators of light pollution. NSB quantified the brightness of skyglow. The measured NSB is a combination of the scattered light from artificial lighting sources and natural emissions. Technically, NSB refers to the flux of “anything” coming from the night sky per unit surface per unit solid angle. Typical units of NSB include magnitude per arcsecond square (mag/arcsec2) and candela per meter square (cd/m2).
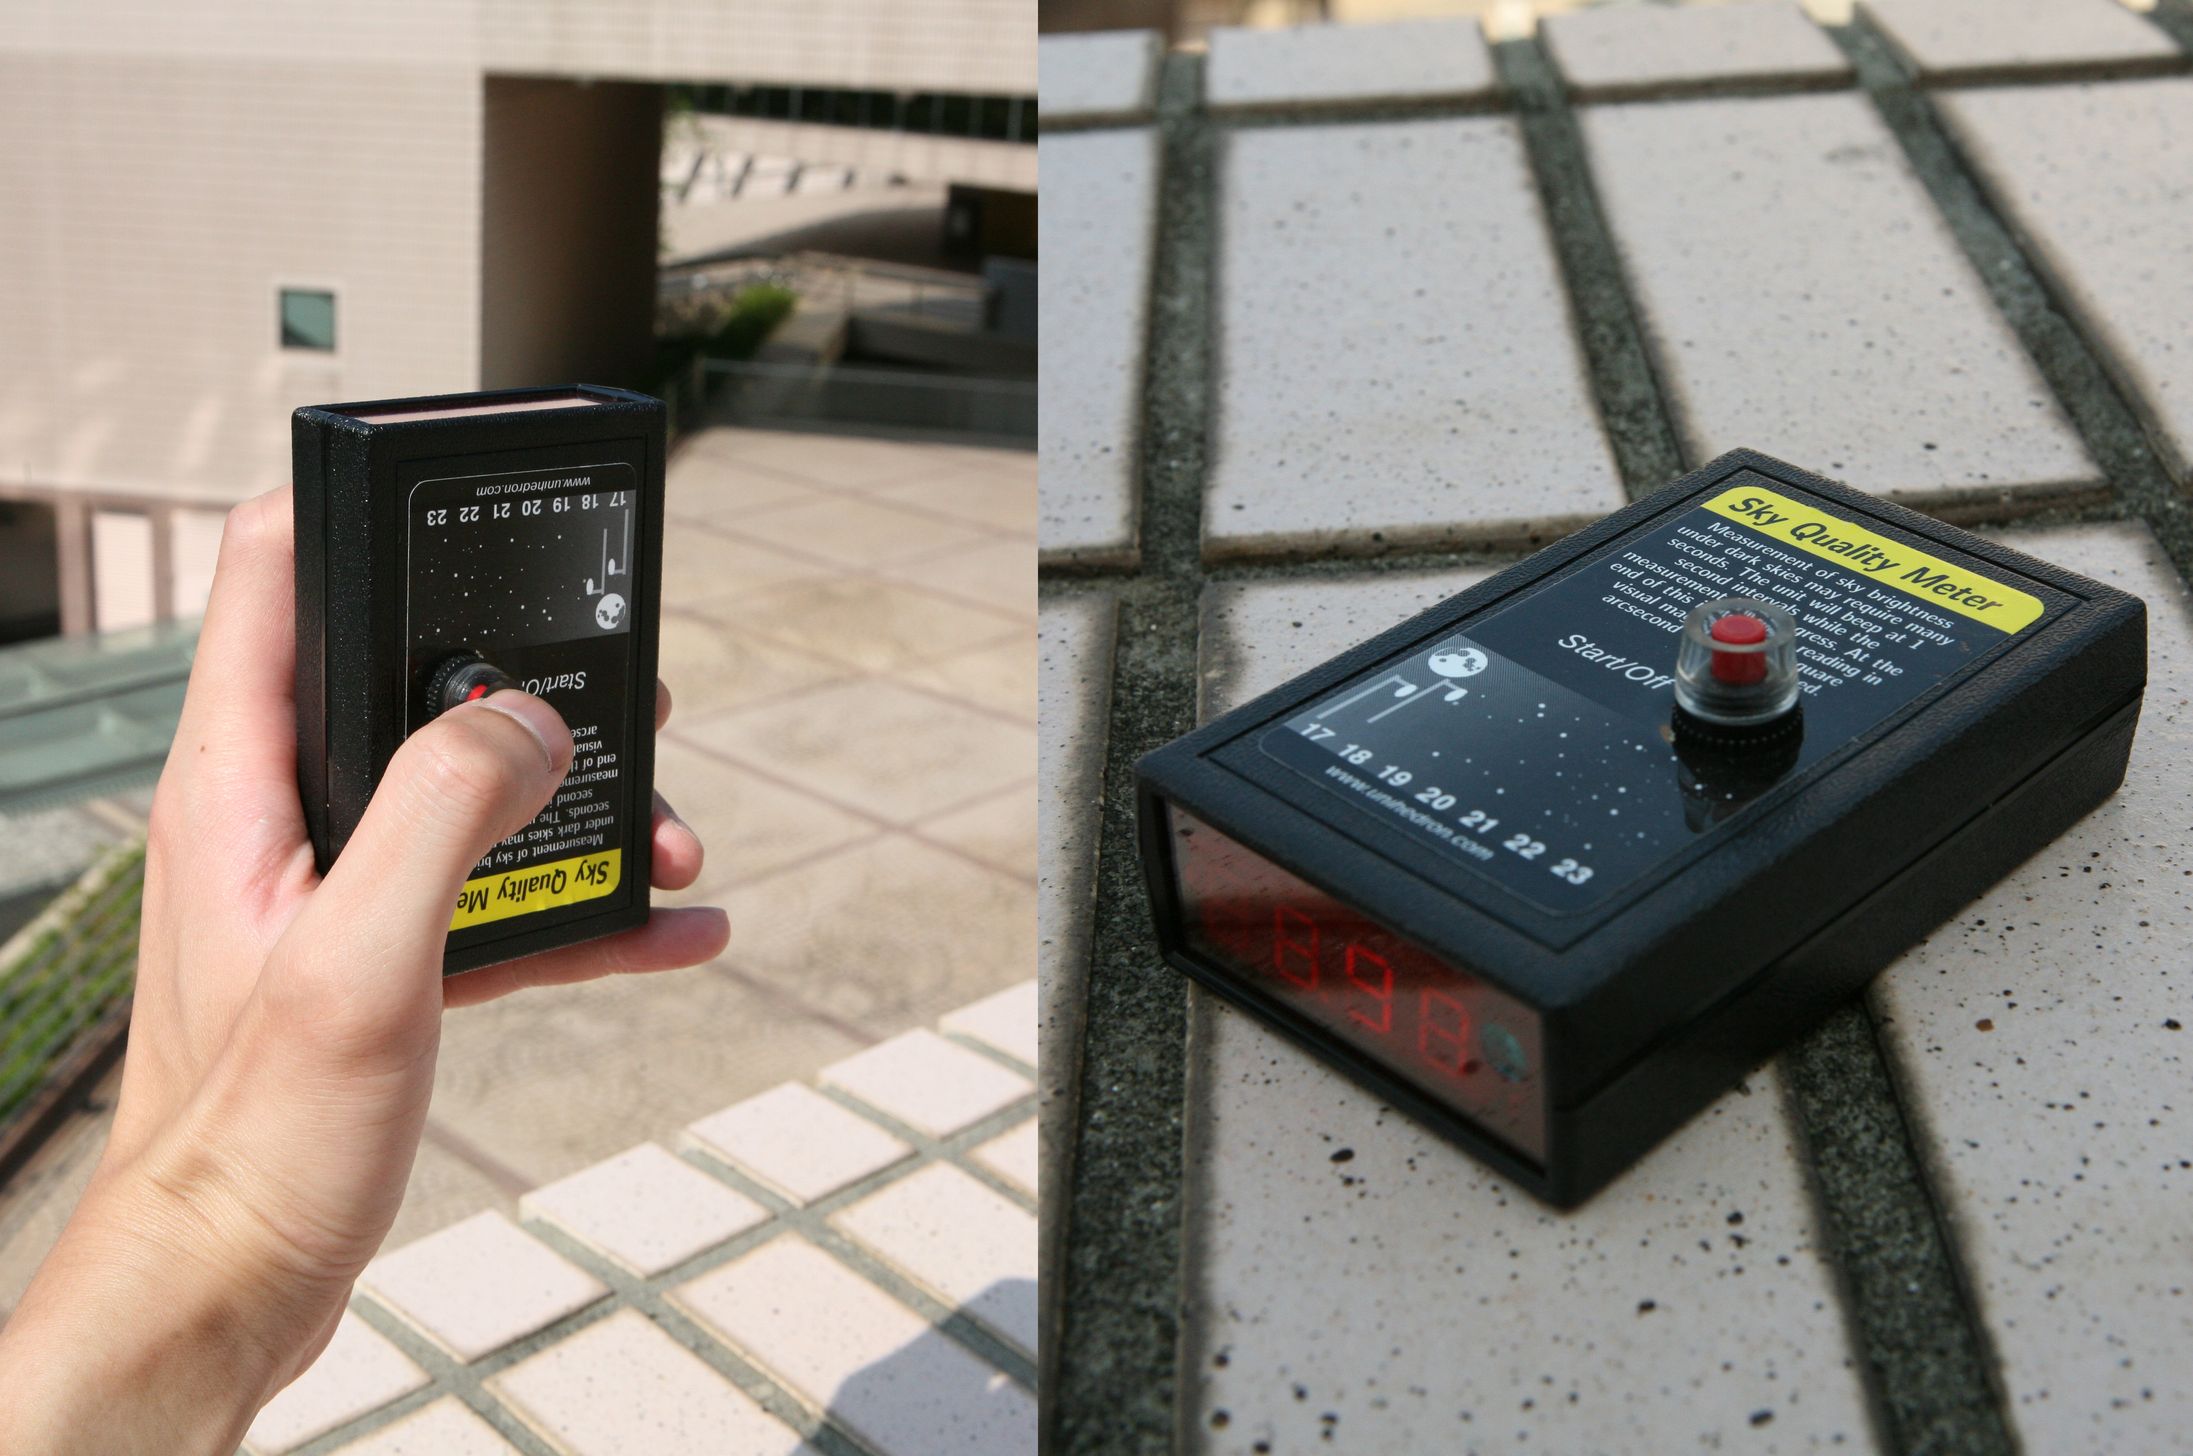
Sky Quality Meter (SQM)
Large geographical, comprehensive temporal coverages, and high accuracy of light pollution monitoring would be possible by the application of low-cost automatic devices for zenith sky brightness measurement such as DigiLum luminance meter, Mark Light Meter, and Sky Quality Meter (SQM). The last one is most widespread and has a series of sub-type offering different choices of hardware interface including Ethernet (SQM-LE), USB (SQM-LU), USB plus data logger (SQM-LU-DL), and RS232 (SQM-LR). The operational requirement of a SQM is very low compare with that for CCD photometry. Also, the device could be easily installed at the location of interest for a long period of time. The sky condition would be read out almost instantaneously at high (down to several seconds) frequency. Via regular maintenance and calibration, the device’s uncertainty is adequate for most applications.

star-free regions on the CCD images is extracted to estimate the NSB
Astronomers are among the worst affected by the worldwide growing light pollution problem due to the diminishing accuracy of astronomical observations on the dim celestial objects under light-polluted skies. Therefore, the level of the NSB has mostly been studied at professional astronomical observatories using the traditional astronomical technique of photometry for many years. The amount of light detected in star-free regions on the CCD images is extracted to estimate the NSB at different wavelength bands. By studying the observed NSB in different parts of the sky and comparing the results from other natural pristine light-pollution free locations where the night sky is brightened mainly by natural light sources, astronomers can accurately reveal potential light pollution threats to the observatory and aid in their search for a new potential dark observing location.
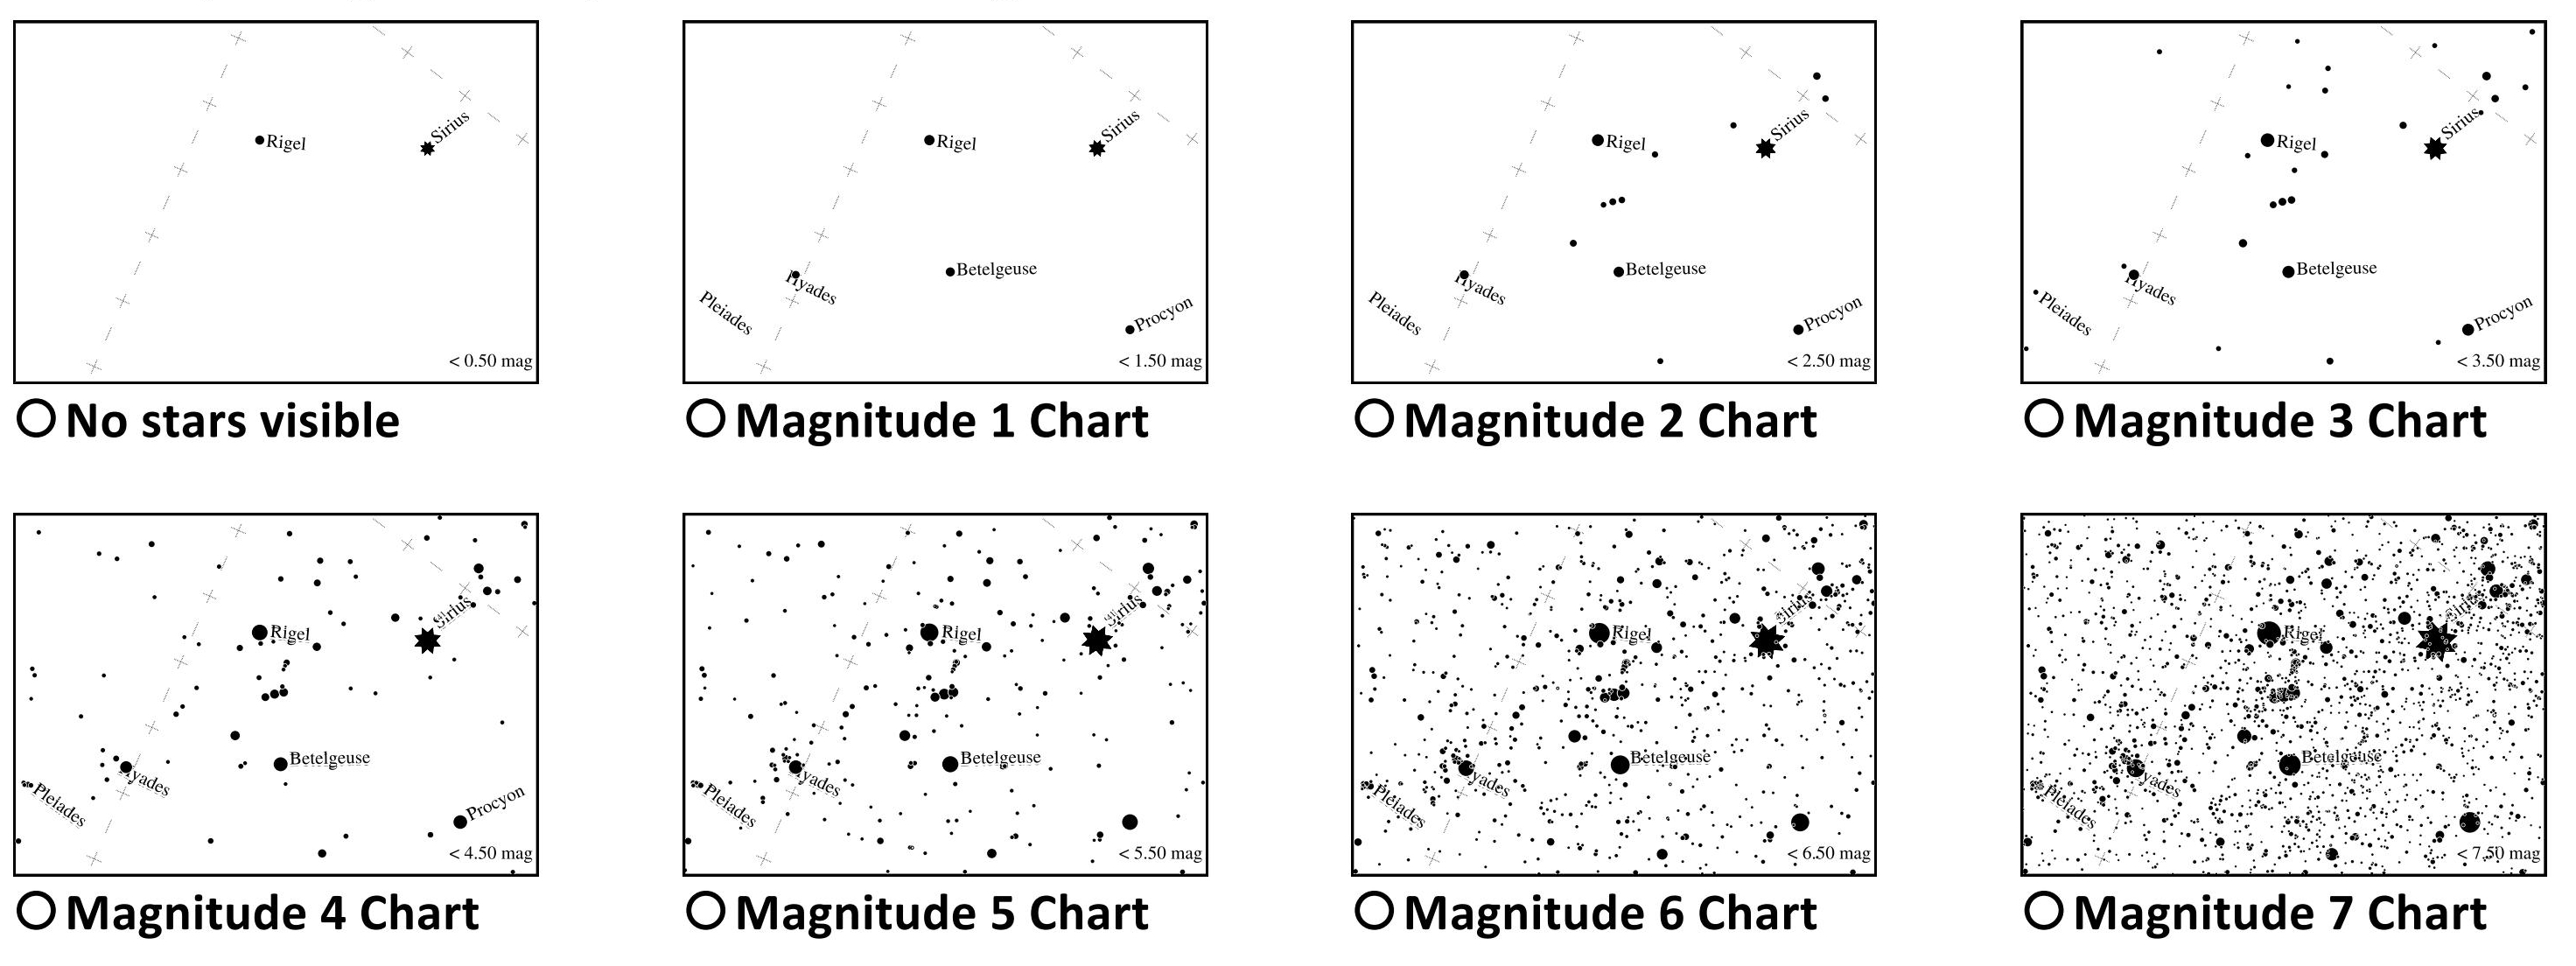
Match nighttime sky to one of the magnitude chats Picture source: Globe at Night
Skyglow decreases the brightness contrast of the night sky and hence reduces the number of stars visible by unaided eyes. Large-scale surveys of the sky conditions have also been carried out by campaigns which recruit ordinary people to conduct visual studies of the night sky following simple procedures with minimal technical expertise required. Globe at Night is an example of such kind of citizen-science project which encourages a large number of people from around the world to take part in estimations on the extent of light pollution by counting the number of stars visible within specific sky patches. More than 100,000 measurements have been contributed from people in 115 countries during the campaigns each winter/spring over the last 9 years, making Globe at Night the most successful light pollution awareness campaign to date.
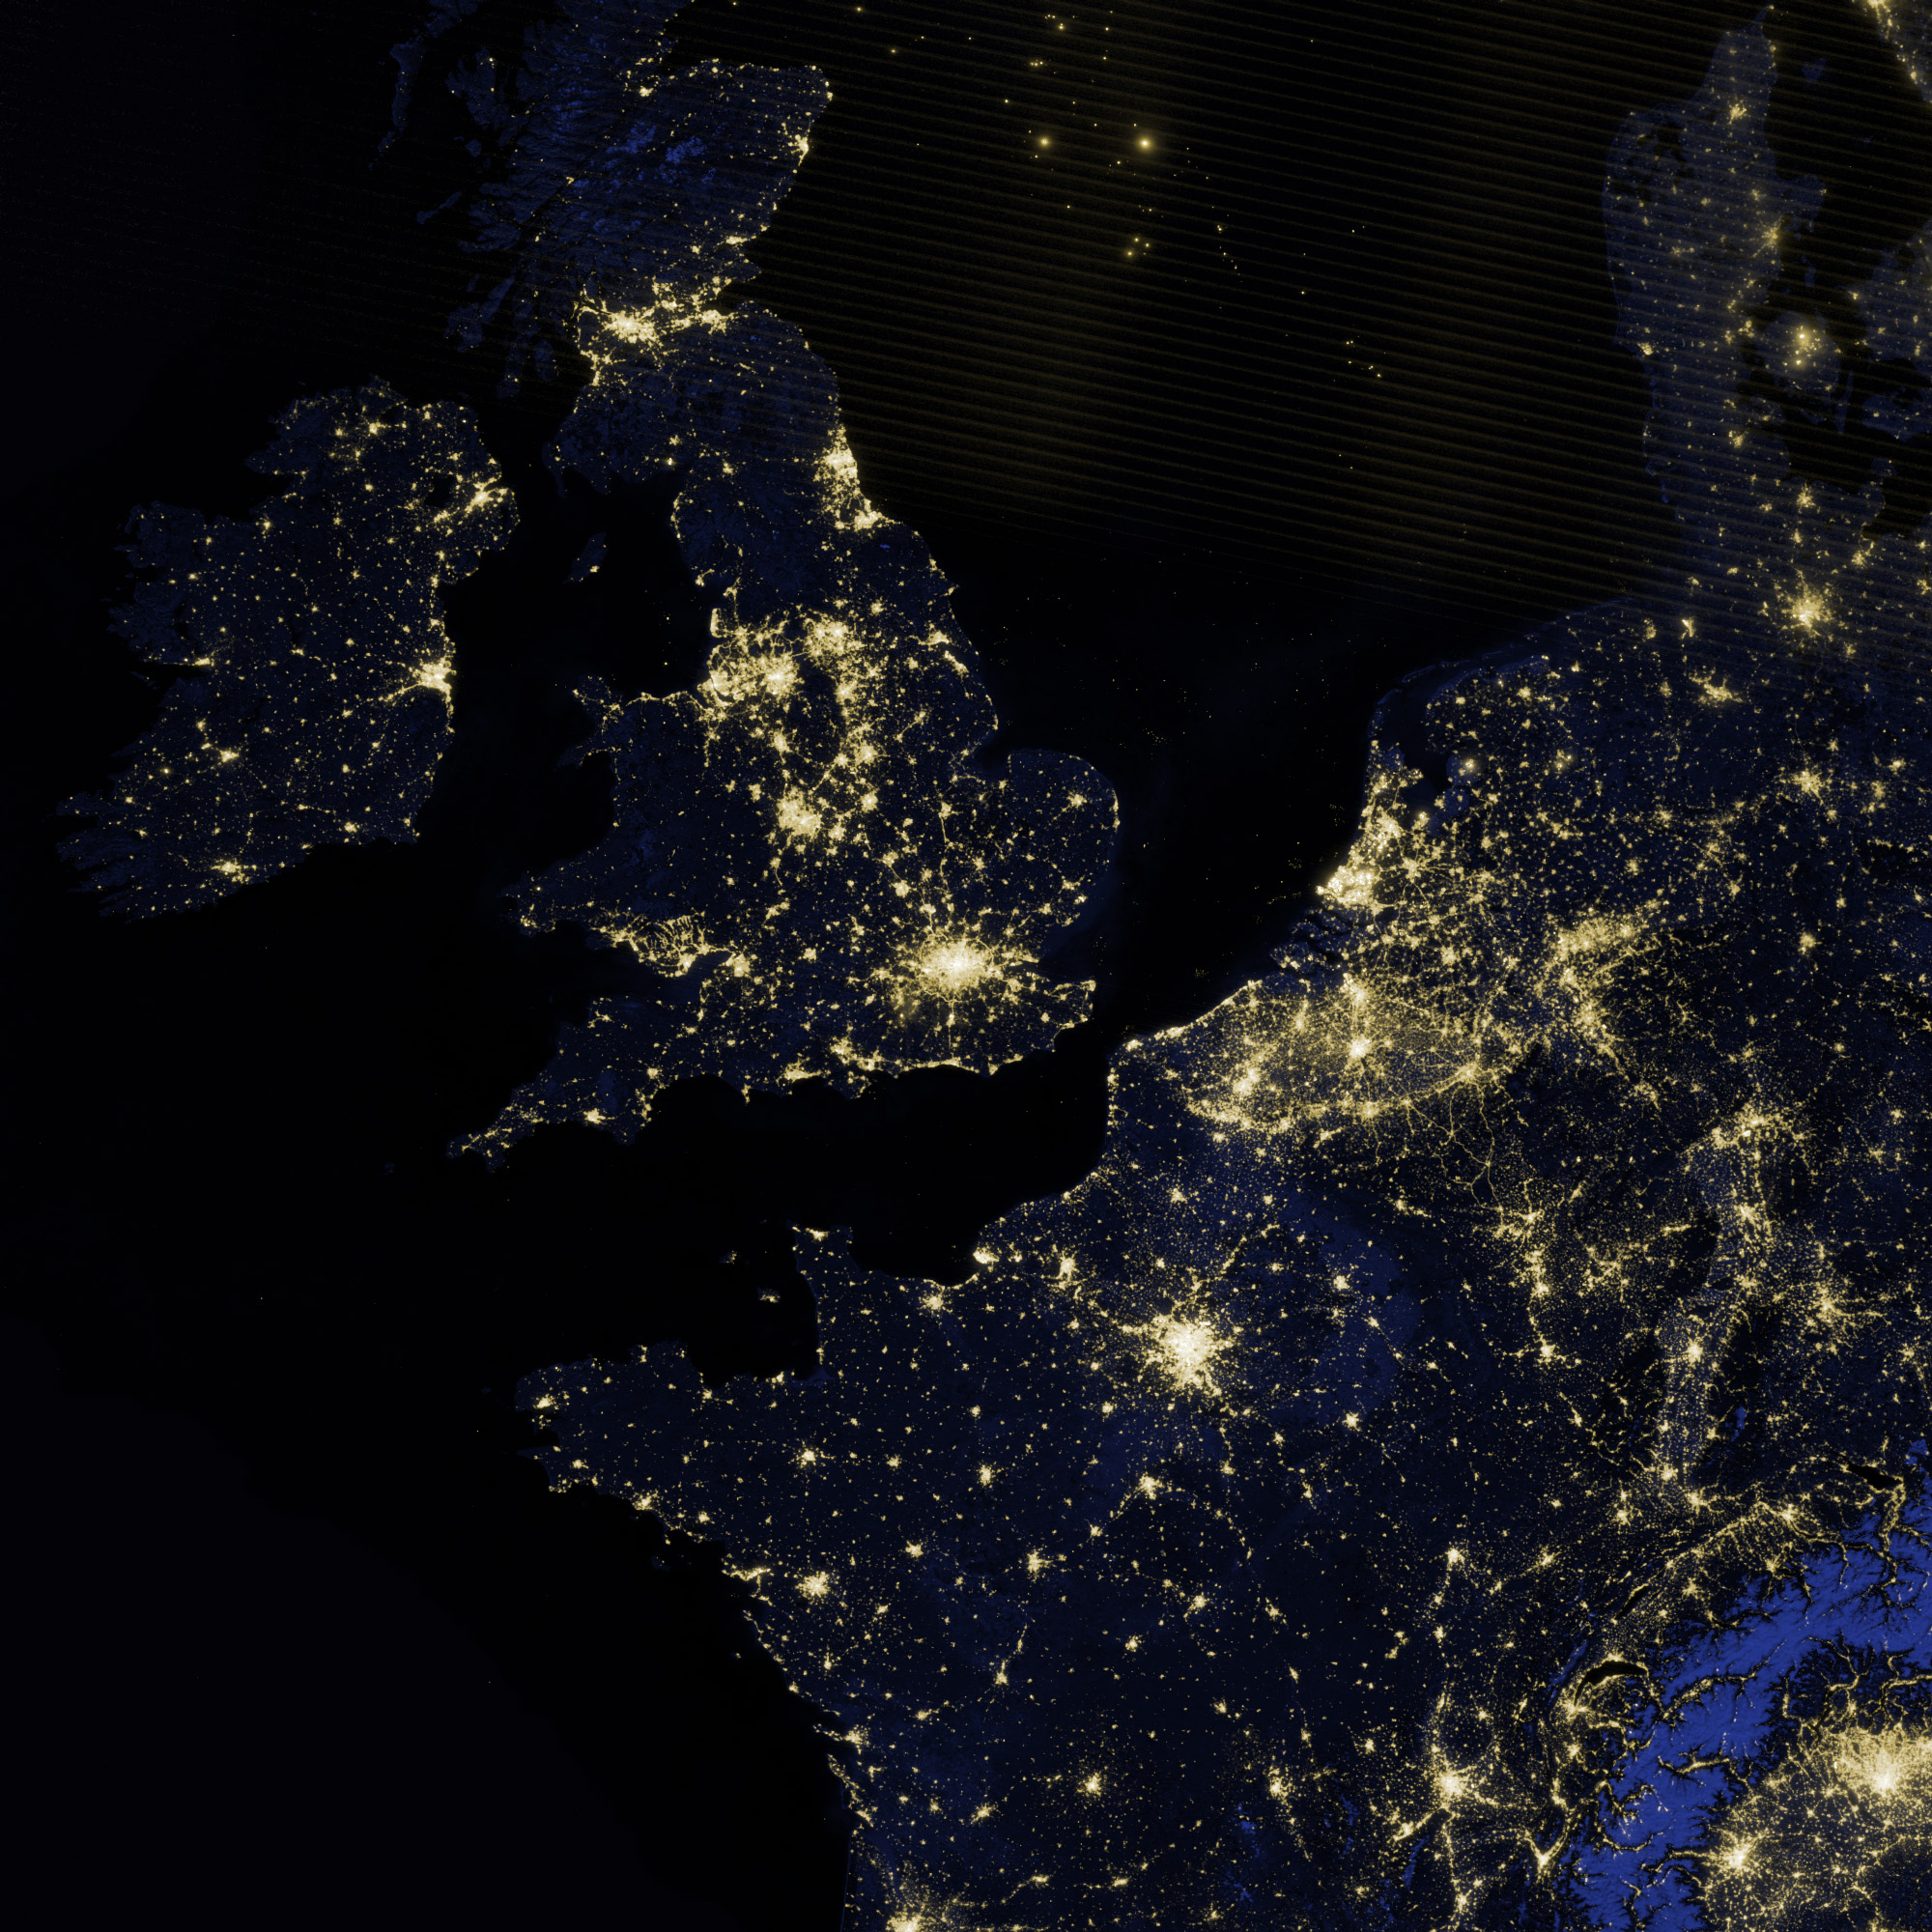
The Lights of London as seen from space Image Credit: NASA Earth Observatory/NOAA NGDCd
Night-time imagery of the Earth taken from space provide a clear perspective of the spatial distribution of light pollution. Currently the Operational Linscan System (OLS) installed on the satellites of the Defense Meteorological Satellite Program (DMSP) and the Visible Infrared Imaging Radiometer Suite (VIIRS) onboard the Suomi National Polar-orbiting Partnership satellite (Suomi NPP) acquired low-light visible data suitable for light pollution study. Bright spots reveal commercial and residential districts while undeveloped forests and deserts are darker patches in the imagery. In addition, photographs taken by astronauts onboard the International Space Station are the high-resolution data sources of the Earth at night. Highways, roads, and the airport are “highlighted” in these photographs due to the presence of sources of light pollution such as street lighting, automobile headlights, and airport terminals.

Sky spectrum of a light-polluted location
Astronomical spectroscopy is adopted to study the spectra of night sky. Spectrograph separates light according to the light frequency and records the signal using a camera. Since each light source has a unique set of spectral features such as emission lines and continuum, the injection of artificial light to the night sky can be identified if manmade features are contaminated in the night sky spectrum.